Simple sales reporting lets you see how your store is performing, use data to help you make decisions. Is a marketing Campaign working? Is it driving in new Customers?
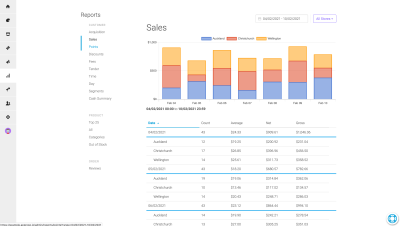
Sales
View your sales, by day, week or month. Compare sales between multiple stores.
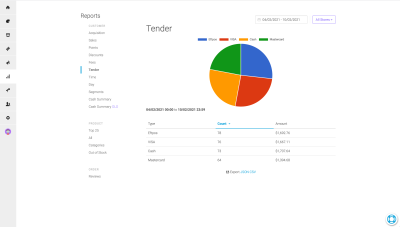
Tender
Which payment methods are customer using.
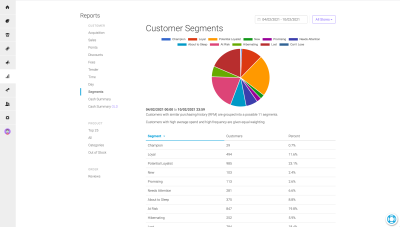
Segments
How many Champion customers do we have, how many customers need some attention to bring them back. We use RFM to group customers by spending behaviour, how recently they visited, how much they spend and how regularly they spend. Read more about RFM Analysis here
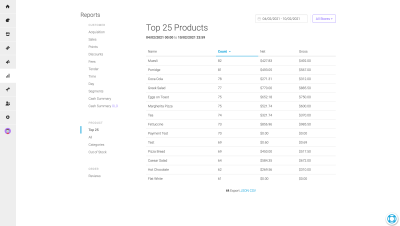
Items
Which items are the most popular, how much do they gross
Acquisition
See when customers are signing up, compare with your marketing campaigns to determine effectiveness
Loyalty Points
Note
POS Integration Required
How many points are spent or earnt each day.
Discounts
How much customers are using a Discount Coupon, or when connected to a POS, which
Time
What time of day is most popular, or least popular. Could a discount help drive business during this quiet time.
Day
What day is most popular, or least popular. Could a discount help drive business during this quiet day.
Product Categories
Products can be categorised in multiple ways, by menu category, by filling, by dietary. Set up your categories and gain insight about your customers. Do they prefer Chicken, Beef or Vegetarian.
Export
You can export all reports to CSV which you can open in Microsoft Excel or Apple Numbers for further analysis.